A common task when either reporting or doing data analysis is to extract data from a database table or view and then lookup corresponding values from either previous or next rows.
A good example of this was a recent KPI report I made for E-commerce where the KPI depended not only on the total daily volumes of orders received but also the the total on each of the previous two days. Therefore I needed two extra columns with the previous days order volume (p1dayorders) and the order volume from two days previously (p2dayorders).
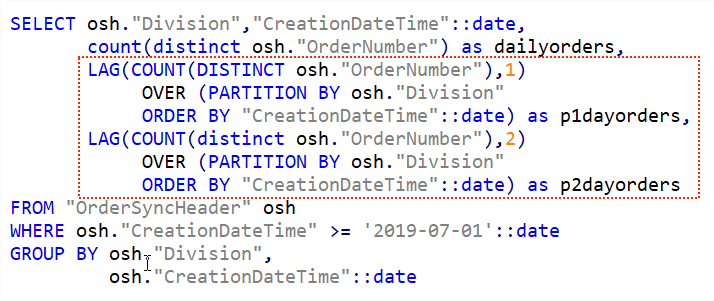
Using the Postgres LAG() function it’s easy to achieve as you can see below. The interesting part is highlighted in red.

The text formatted version that can be copied is available below.
SELECT osh."Division","CreationDateTime"::date,count(distinct osh."OrderNumber") as dailyorders,
	LAG(COUNT(DISTINCT osh."OrderNumber"),1)
		OVER (PARTITION BY osh."Division"
		ORDER BY "CreationDateTime"::date) as p1dayorders,
	LAG(COUNT(distinct osh."OrderNumber"),2)
		OVER (PARTITION BY osh."Division"
		ORDER BY "CreationDateTime"::date) as p2dayorders
FROM "OrderSyncHeader" osh
WHERE "osh"."CreationDateTime" >= '2019-07-01'::date
GROUP BY osh."Division",
	 osh."CreationDateTime"::date
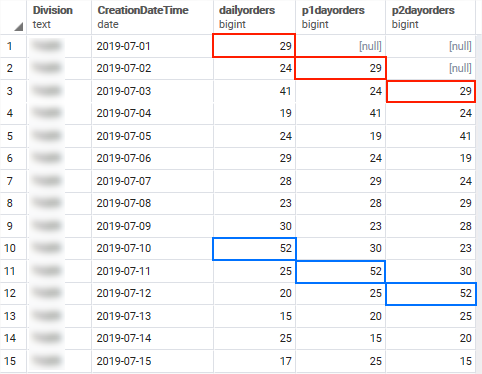
The resulting output shows that we now have the daily order volumes in the dailyorders column, total from the previous day in the p1dayorders column while p2dayorders shows total from two days back.

Note the [null] values in the first two rows. This is caused by the data being outside of the window since we do not have previous days data for the first record returned. If you wish to return another value instead of NULL this is also possible by using the optional default argument. This code will return 0 for missing values.
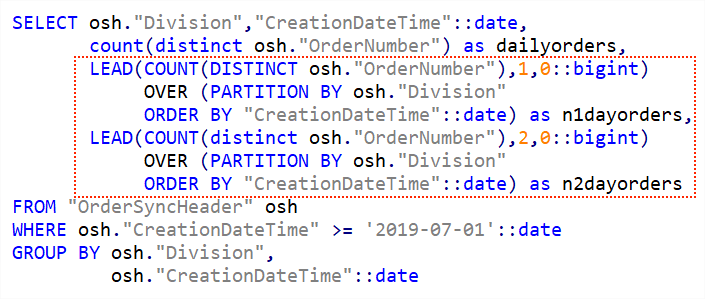
LAG(COUNT(DISTINCT "osh"."OrderNumber"),1,0::bigint) The LEAD() function as you might guess does a similar task but instead of looking back looks forward. The syntax is otherwise identical.

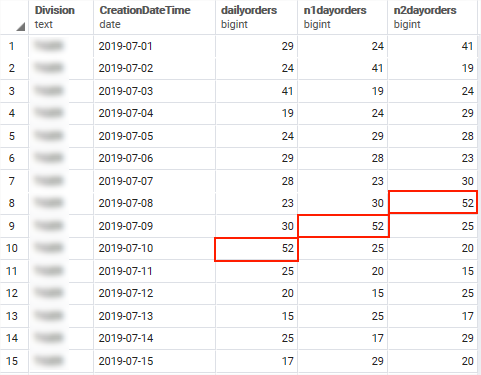
Gives this output with n1dayorders and n2dayorders being the following one and two days order counts.

