
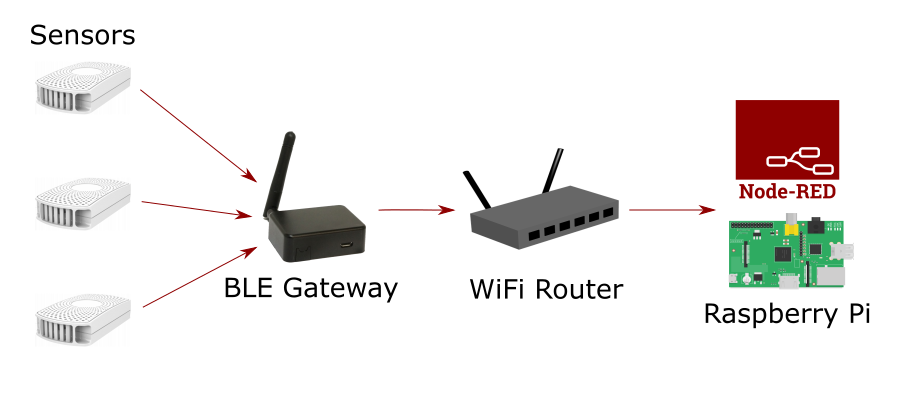
In the first part I talked mostly about the sensors and the gateway so in this article I’ll show you how to collect, filter and store that data from the sensors.
My setup is running locally on my LAN and uses a Raspberry Pi 3B+ to process the data. I’ll be using Node-RED to process the data as it’s ideally designed to work with IoT devices.
Since everything is on my LAN I’ll not be covering securing the setup which you should do if you plan to send the data to a server on the internet.
As a prerequisite Node-RED must already be installed on you computer (pi, computer, laptop etc. that you will use). To install Node-RED on a Raspberry Pi follow these instructions, Running on Raspberry Pi.
Collecting Data with MQTT
Collecting and displaying the raw data from the gateway is very simple and only required two nodes, an MQTT In node and a debug node to display the data.
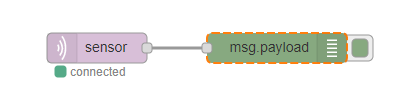
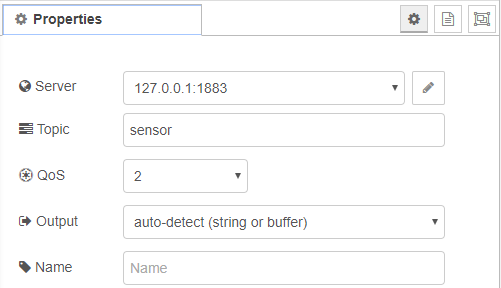
The MQTT In node should be set to the same topic that you created in the MQTT setting in the gateway so messages sent from the gateway will be received in your flow. In my case I used a topic called sensor.
If you deploy the node you will immediately see messages appearing in the debug panel. In fact I was surprised just how many messages are collected as they scroll by at an amazing rate. It’s like a fire hose of data being streamed into the node!
This is of course because the BLE gateway is not just getting signals from your sensors but from every device it can see, which turns out to be quite a lot! This includes, phones, tablets, speakers, TVs and so on.
One second of data collection looks something like this.
$GPRP,5413792CD278,C2E3301C731B,-88,1AFF4C00021550765CB7D9EA4E2199A4FA879613A492D89165DFCE,1571855948
$GPRP,A43135132392,C2E3301C731B,-65,02011A0BFF4C0009060342C0A8000C,1571855948
$GPRP,3468958805F0,C2E3301C731B,-59,1AFF4C00021550765CB7D9EA4E2199A4FA879613A4928E16B1DCCE,1571855948
$GPRP,74915D4253F8,C2E3301C731B,-73,02011A020A0C0AFF4C0010055E1C1BD2B5,1571855948
$GPRP,769A668E87A7,C2E3301C731B,-92,02011A020A0C0AFF4C00100503183F07D2,1571855948
$GPRP,30577CFEB6F3,C2E3301C731B,-65,1EFF0600010920023C43EA1413D40836D664A542F62640EB2277A043E7D913,1571855948
$GPRP,01F9BF4918AA,C2E3301C731B,-98,1EFF060001092002D0CE87C2A286D03038FE638259D0382691F9E46E0C76BB,1571855948
$GPRP,74802DB4E25D,C2E3301C731B,-51,02011A020A0C0AFF4C001005031C035C01,1571855948
$GPRP,AC233FA054B7,C2E3301C731B,-61,0201060303E1FF0E16E1FFA10864B754A03F23AC5331,1571855948
$GPRP,74915D4253F8,C2E3301C731B,-73,02011A020A0C0AFF4C0010055E1C1BD2B5,1571855948
$GPRP,5AF1927F967F,C2E3301C731B,-82,02011A0AFF4C001005071C101707,1571855948
$GPRP,3468958805F0,C2E3301C731B,-60,02011A1107FC9DD0B3CB84E0840642F3F7E1E0BFCB,1571855948
$GPRP,5413792CD278,C2E3301C731B,-88,02011A1107FC9DD0B3CB84E0840642F3F7E1E0BFCB,1571855948
$GPRP,3468958805F0,C2E3301C731B,-59,1DFF2D010200011076DA132B92034D34962819DAFB7329457181589D10EE,1571855948
The basic format of each message is the same.
$report type,tag id,gateway id,rssi,raw packet content,*unix epoch timestamp
Where the message parts are defined below.
| report type | GPRP: general purpose report . SRRP: active scan response report |
| tag id | MAC address or ID of tag/beacon |
| gateway id | MAC address of gateway’s BLE |
| rssi | RSSI of tag/beacon |
| raw packet content | Raw packet received by the gateway |
| unix epoch timestamp | Optional timestamp when NTP is enabled |
Filtering the Data
To filter the data so we only see the messages sent from our sensors is made simple by the fact that the message contains the MAC address of the originating message.
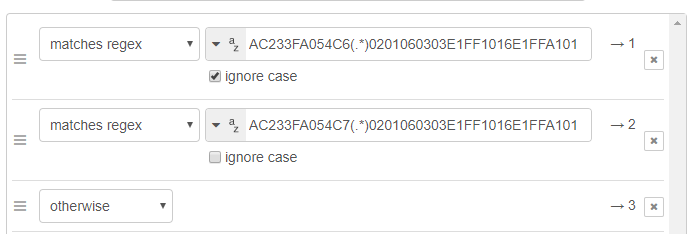
Therefore we can add a switch node to only allow process our MAC addresses. In this case MAC address AC233FA054C6 will go to output 1, AC233FA054C7 to output 2 and everything else to output 3.
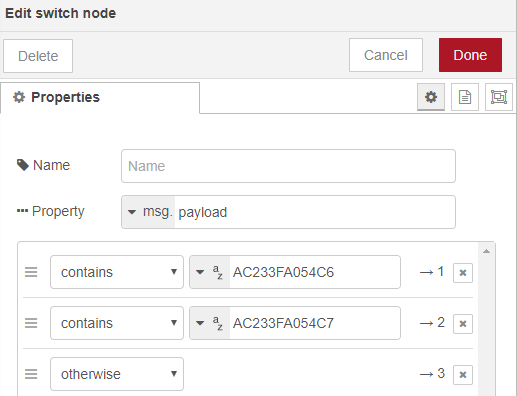
If we don’t connect any downstream nodes to output 3 they will be effectively discarded. By splitting our sensors by output we are also able to label them so in the following nodes I use a function to identify which device is inside and which is outside.
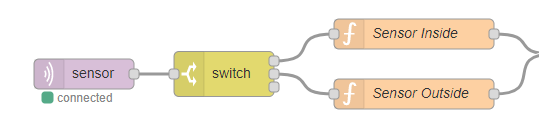
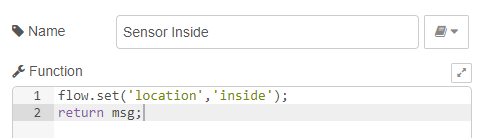
Here the sensor being sent to output 1 is the one inside so the function creates a flow variable called ‘location‘ I’ll use later in the flow.
Message Slots
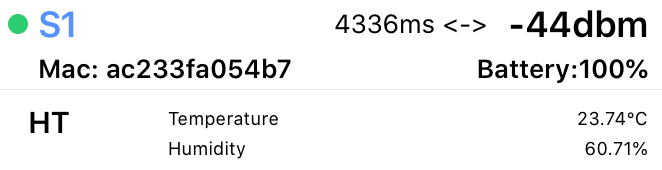
Now we’ve removed all the data not related to our sensors you notice that we still get two different messages from each sensor.
If you remember when we set up the S1 sensor beacon we only activated two slots. This means that the sensor will actually send two messages, one with some general info and another with our temperature and humidity data. If we had left all six slots activated we would receive six different messages.
The actual messages look like these.
$GPRP,AC233FA054C6,C2E3301C731B,-61,0201060303E1FF0E16E1FFA10864C654A03F23AC5331,1571855948
$GPRP,AC233FA054C6,C2E3301C731B,-52,0201060303E1FF1016E1FFA1016417633C70C654A03F23AC,1571855949
If we take the first message payload only (0201060303E1FF0E16E1FFA10864C654A03F23AC5331) we can see that it’s split into header and data sections as shown below.
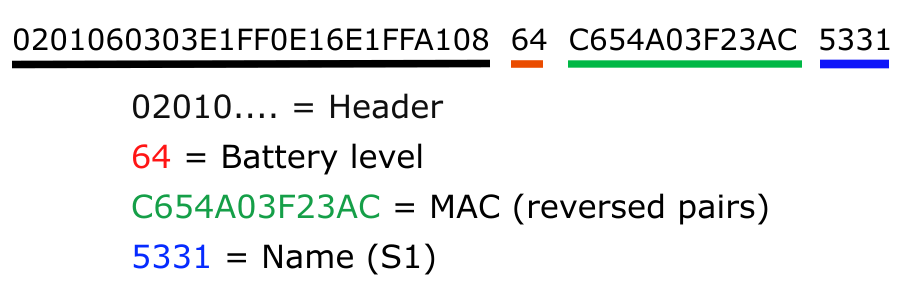
This turns out to be the info slot. Note that the message is in hex format so battery level 64 actually equals 100 in decimal and 5331 equals S1, or the name of the sensor.
The next slot we assume must be our temperature and humidity data.
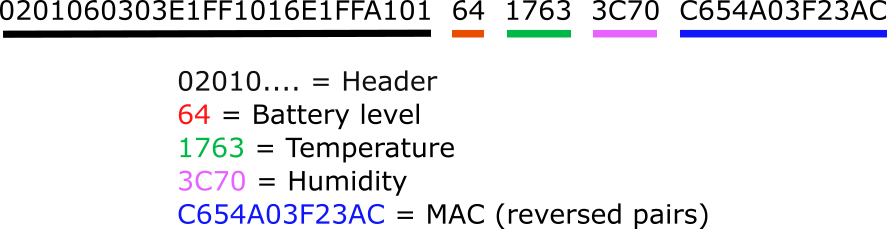
Since the headers for the temperature/humidity data are slightly different (they end in 01 instead of 08) from the info data we can now modify our switch node so we only get our sensors and we only see the temperature/humidity slot.
Converting Temperature and Humidity
The next challenge is actually getting the temperature and humidity from the data. You might think this is also hex encoded but you’ll see that hex 1763 is 5987 in decimal and 3C70 is 15472 so it seems we have some conversion to do.
Actually this data is encoded in signed 8.8 fixed point notation! Fortunately I’m not the first person to ask the question regarding decoding sensor data so the answer is conveniently on Stack Overflow, as always 🤟
If we use the function shown below with our values for temp and humidity we get the correct data out.
function FixedPoint(fraction){
  this.fraction = fraction;
}

FixedPoint.prototype.calculate = function(value){
  let intValue = parseInt(value, 16);
  let signed = (intValue & 0x8000) > 0 ? -1 : 1;
  return signed * intValue / Math.pow(2, this.fraction);
}

let decodData= new FixedPoint(8);
decodData.calculate('1763');
Our data point of 1763 converts to 23.3203125 which looks like a reasonable temperature and the humidity of 3C70 converts to 60.4375.
To be sure the data agrees you can open the BeaconSET+ app and check the readings there.
Final Function
Putting these steps together I have a single function to process the data, it
- Get the sensor locations from the saved variables (switch node)
- Uses split() to get the timestamp from the message
- Converts UNIX timestamp to JavaScript Date object
- Use split() to get the advertising payload from the message
- Extract tempo and humidity strings
- Convert to hex and decode from fixed point to decimal
- Create a msg.payload for writing to the debug window.
// Convert IUnix time to Date
function UnixToDate(unix_timestamp){
    return new Date(unix_timestamp*1000);
}

// signed 8.8 fixed point functions
function FixedPoint(fraction){
  this.fraction = fraction;
}
FixedPoint.prototype.calculate = function(value){
  let intValue = parseInt(value, 16);
  let signed = (intValue & 0x8000) > 0 ? -1 : 1;
  return signed * intValue / Math.pow(2, this.fraction);
}

//get location from variable
var location = flow.get('location') || '';

let decoder= new FixedPoint(8);

//get timestamp from message
unixtime = parseInt(msg.payload.split(",")[5])

//get advertising message
data = msg.payload.split(",")[4]

// get temperature
hextmp = "0x" + data.substr(28,4)
dectmp = decoder.calculate(hextmp);

//get humidity
hexhum = "0x" + data.substr(32,4)
dechum = decoder.calculate(hexhum);

// create msg.payload
msg.payload = "Location:" + location + "\n" +
                "Temp: " + dectmp + "c" + "\n" +
                "Humidity: " + dechum +"%" + "\n" +
                "Time: " + UnixToDate(unixtime)
return msg;
When deployed we see the following data in the debug window. Success!
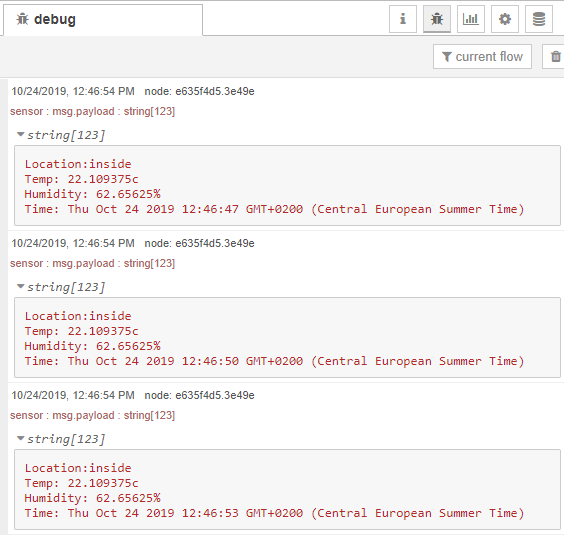
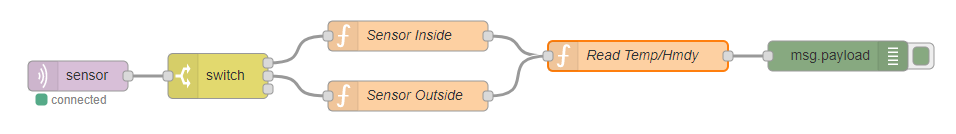
Our full flow in Node-RED is shown below, very small for what we have achieved.
Leave a comment