IoT Sensors – Saving Collected Data

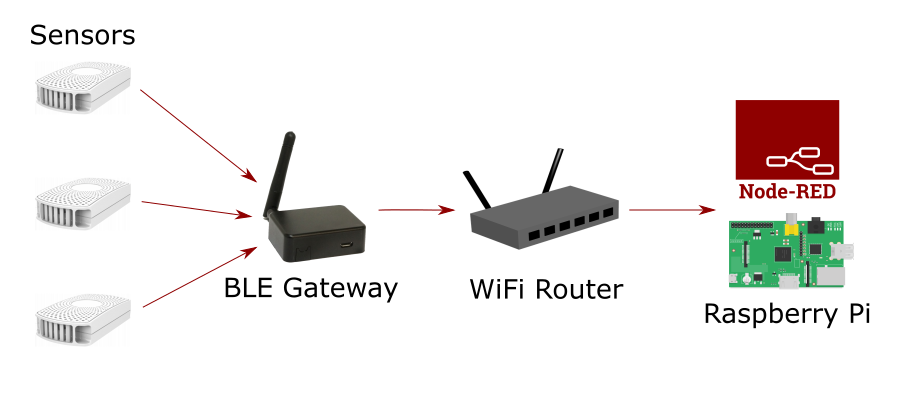
Now that my sensors are successfully collecting data and the data is being processed by a Node-RED flow on my Raspberry Pi the final step is to add some persistence to the data.

As it stands the data is constantly streaming and being displayed on a dashboard but after that it’s discarded so there’s no way to see the min or max temperature for say the last 24 hours. We need a database to store and query the data.

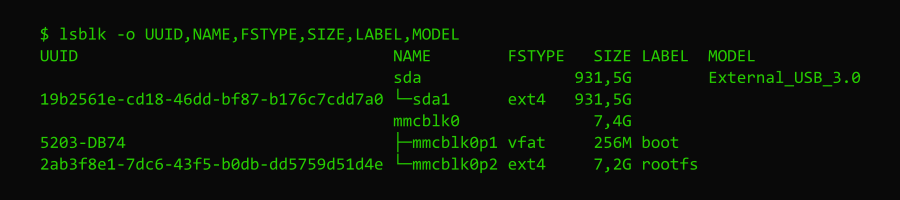
If you intend to use a Raspberry Pi as I have done then I wouldn’t recommend setting the database up on the SD card as the read-write traffic can easily wear out the card prematurely. For this reason I mounted an external USB drive to the Pi and create the SQLite database on the external drive.
You can read this post to learn how to mount an external drive in Linux.

Choosing a Database

Three choices spring to mind that could work equally well on a small device with limited computing power, SQLite, MySQL and PostgreSQL. All are readily available to install and reasonably easy to set up but for our data SQLite stands out as being by far the easiest to set up and administer.

The one major downside to consider with SQLite is that it’s a file based database meaning that you won’t be able to access the data from your LAN or the internet (at least it’s not recommended). If you need to do this consider PostgreSQL or MySQL.

To install the SQLite node in Node-RED follow these instructions.

Database Setup

I use the command line to create a database for our sensor data as it’s very easy and requires no extra install. First open a terminal, create the directory and then a database, mine is called sensors in /mnt/hdd/sqlite/

$ mkdir /mnt/hdd/sqlite/
$ cd /mnt/hdd/sqlite
$ sqlite3 sensors
SQLite version 3.27.2 2019-02-25 16:06:06
Enter ".help" for usage hints.
sqlite>

Now your in the sqlite3 command prompt so we can go ahead and create a table for our data.

create table sensordata (location text, temp float, humidity float, timestamp integer);

Our table is very simple and just has four fields, location, temperature, humidity and timestamp. You can close sqlite3 using .quit. That’s all that’s required outside of Node-RED, our database is ready for data!

Using Node-RED with SQLite

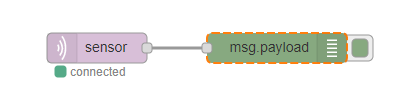
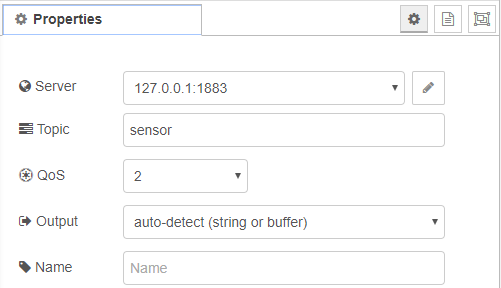
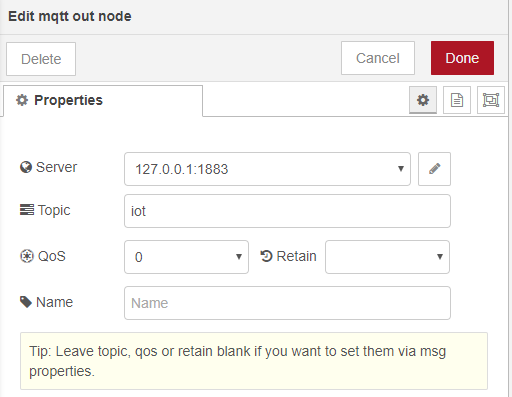
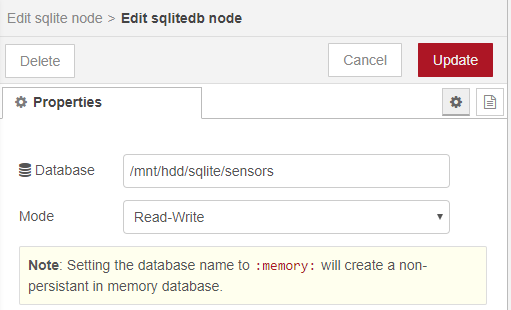
The sqlite node requires little configuration, just add the node to the canvas and open the configuration. In the database entry click on the pencil icon to open the second screen shown below.

In the right hand screen type the location of the database you just created and make the mode Read-Write. Do Not make the mode Read-Write-Create otherwise the node will create a new database for you and will overwrite the one we already created.

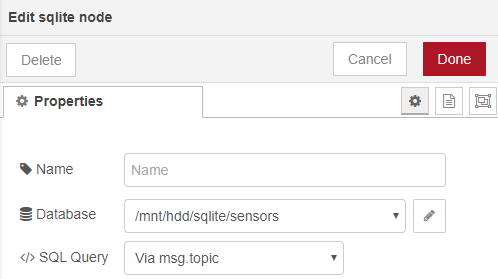
The node is now configured. To write or query data in the database send SQL insert statements to the node via the msg.topic so leave the SQL Query entry as-is.

Inserting Sensor Data

To inset data we create a msg.topic containing the inset statement we require, for example.

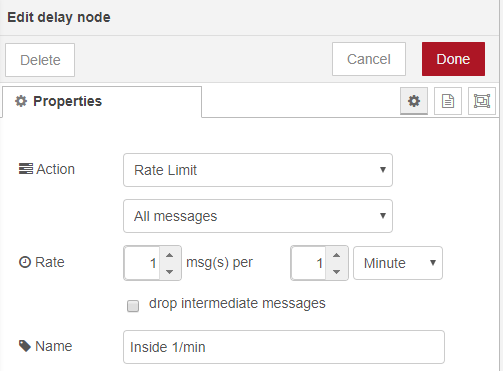
msg.topic = "insert into sensordata values('" + location + "'," + dectmp + "," + dechum + "," + unixtime+")"

Another item to consider is that our beacons send new data every 3 seconds which is great for our live dashboard but is probably excessive for saving data. To reduce the volume of data we can add a delay node set to only allow one message per minute.

Just make sure if you have multiple sensors this applies per sensor otherwise we risk losing data form some locations.

Node-RED delay node
Allow one message per minute

We can check the data is being correctly inserted into the database using the sqlite3 command line again. Open the database in SQLite3 and query the database.

$ sqlite3 sensors
SQLite version 3.27.2 2019-02-25 16:06:06
Enter ".help" for usage hints.
sqlite> select count(*) from sensordata;
5916

We see that the database has 5915 rows of data. We can now query the database to get min and max statistics per location for example and also show this data on the dashboard.

sqlite> select location,min(temp),max(temp),avg(temp) from sensordata group by location;
inside|20.91796875|21.88671875|21.2298818322616
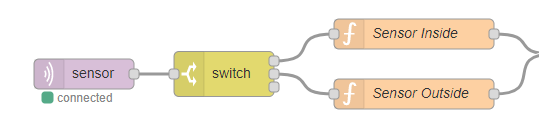
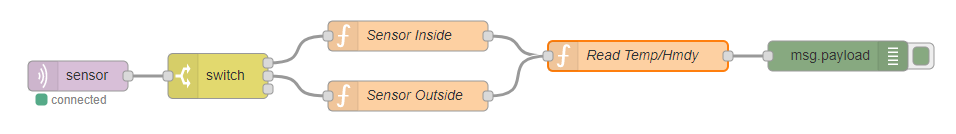
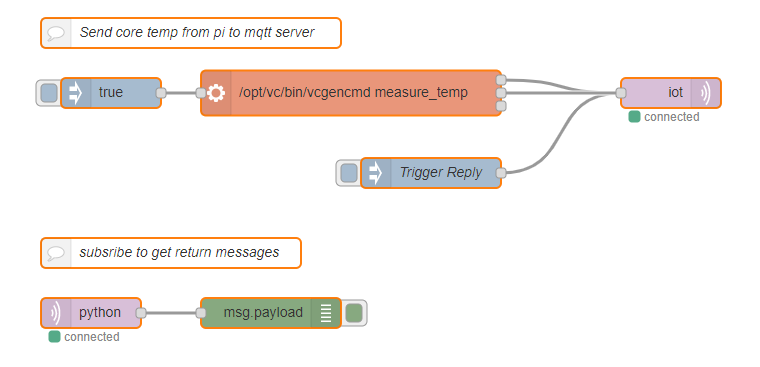
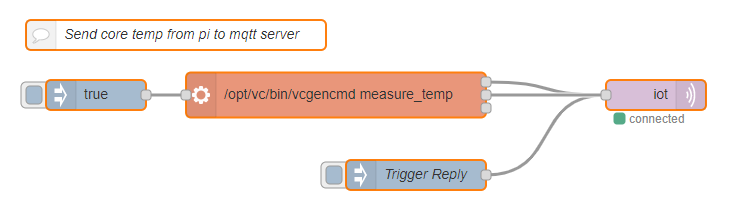
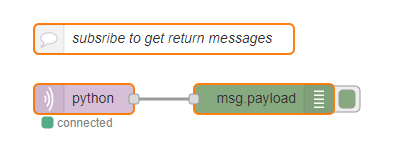
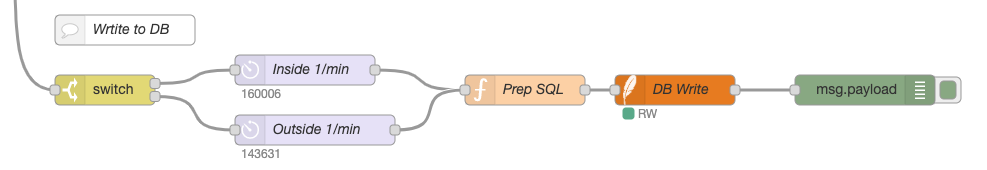
outside|21.15625|23.21875|21.5752918956044

The flow to save the data is shown below showing the nodes to throttle the data for each sensor.

Writing data to the database

Adding Statistics

Node-RED historical sensor data
Statistics flow for historical data

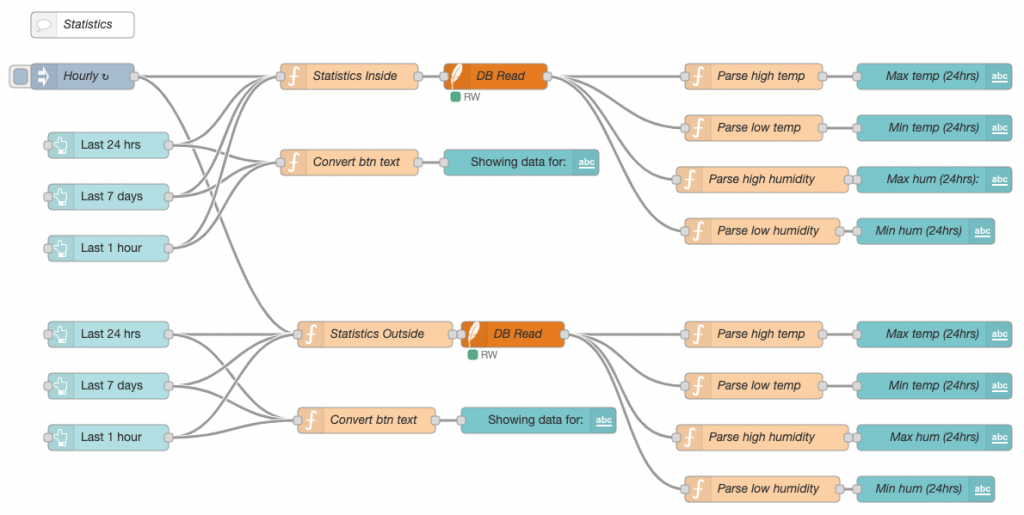
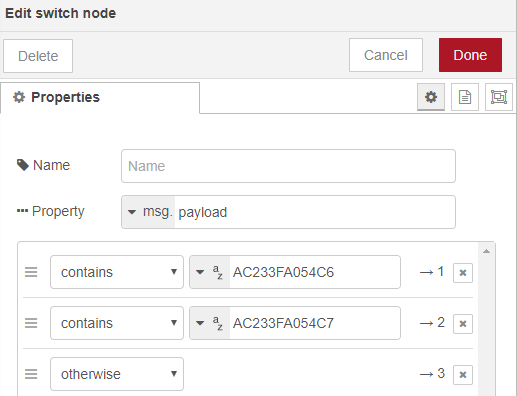
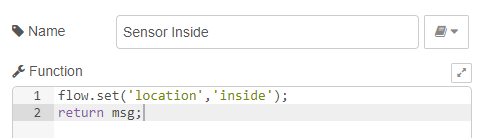
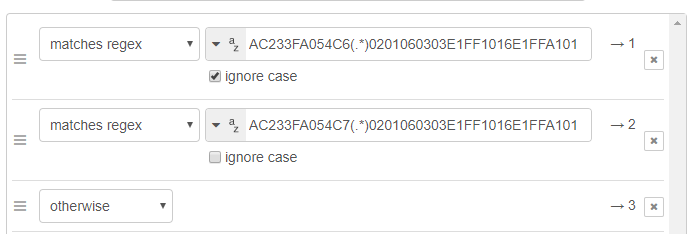
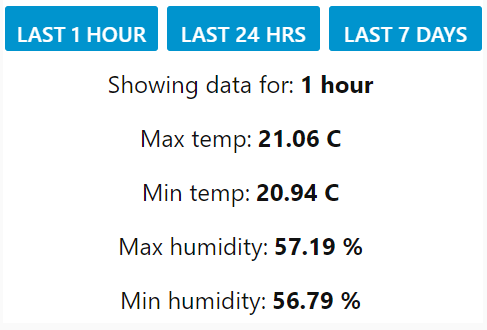
This flow creates three buttons on the dashboard, one to show statistics for the last hour, one for the last 24 hours and the other for the last 7 days. The buttons are set up to send numerical data in hours, 1, 24 and 168 and the function node then creates an SQL statement for the required period by modifying the timestamp.

// converts hours injected to seconds
timespan = msg.payload*60*60

// gets current time in milliseconds, converts to seconds and subtracts the 'lookback'
msg.topic = "select max(temp) tmphigh,min(temp) tmplow,max(humidity) humhigh,min(humidity) humlow from sensordata where location='inside' and timestamp >= " + (Math.round((new Date()).getTime() / 1000)-(timespan))
return msg;

This function converts hours sent from the button node to seconds and then creates an SQL statement that filters the data using a WHERE statement that calculates the current UNIX time and minuses the required period.

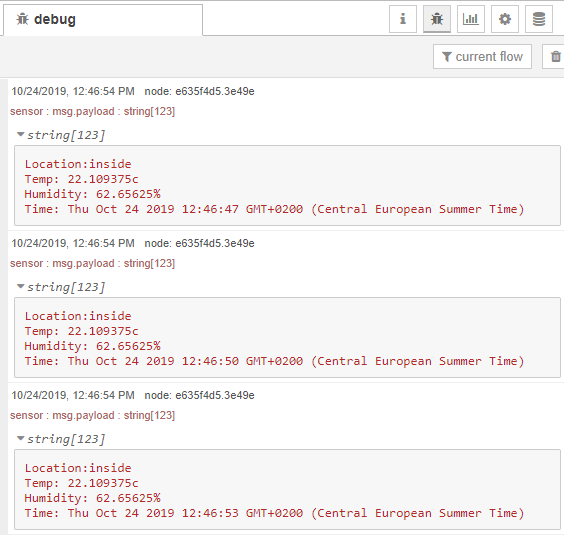
Once the query is sent to SQLite the final nodes are to format the output and display the data as text on the dashboard along with a text label that changes depending on which button was pressed last.

Sensor statistics taken from SQLite

We could also add statistics for when the min and max temperatures were recorded with this SQL.

sqlite> SELECT location,datetime(timestamp, 'unixepoch', 'localtime'),temp FROM sensordata WHERE temp=(SELECT min(temp) FROM sensordata);
inside|2019-10-30 06:18:23|20.91796875
inside|2019-10-30 06:19:23|20.91796875
...
inside|2019-10-30 06:30:22|20.91796875
inside|2019-10-30 06:31:22|20.91796875

We see the min temp has many records starting at 06:18:23 and ending 06:31:33.

Summary

We have now setup sensors, collected the data using Node-RED and MQTT, created a dashboard to show the live streaming data and also used a SQLite database to store the data for later querying.

This solution could easily be extended with extra sensors of the same type or we could add other sensors such as Hall sensors (to monitor doors or windows opening), CO2 sensors and so on.

We could also add analytics to our solution by querying the data from the database.

IoT Sensors – Data Collection

IoT Network Overview

In the first part I talked mostly about the sensors and the gateway so in this article I’ll show you how to collect, filter and store that data from the sensors.

My setup is running locally on my LAN and uses a Raspberry Pi 3B+ to process the data. I’ll be using Node-RED to process the data as it’s ideally designed to work with IoT devices.

Since everything is on my LAN I’ll not be covering securing the setup which you should do if you plan to send the data to a server on the internet.

As a prerequisite Node-RED must already be installed on you computer (pi, computer, laptop etc. that you will use). To install Node-RED on a Raspberry Pi follow these instructions, Running on Raspberry Pi.

Collecting Data with MQTT

Collecting and displaying the raw data from the gateway is very simple and only required two nodes, an MQTT In node and a debug node to display the data.

Simple MQTT data collection

The MQTT In node should be set to the same topic that you created in the MQTT setting in the gateway so messages sent from the gateway will be received in your flow. In my case I used a topic called sensor.

MQTT In node configuration

If you deploy the node you will immediately see messages appearing in the debug panel. In fact I was surprised just how many messages are collected as they scroll by at an amazing rate. It’s like a fire hose of data being streamed into the node!

This is of course because the BLE gateway is not just getting signals from your sensors but from every device it can see, which turns out to be quite a lot! This includes, phones, tablets, speakers, TVs and so on.

One second of data collection looks something like this.

$GPRP,5413792CD278,C2E3301C731B,-88,1AFF4C00021550765CB7D9EA4E2199A4FA879613A492D89165DFCE,1571855948
$GPRP,A43135132392,C2E3301C731B,-65,02011A0BFF4C0009060342C0A8000C,1571855948
$GPRP,3468958805F0,C2E3301C731B,-59,1AFF4C00021550765CB7D9EA4E2199A4FA879613A4928E16B1DCCE,1571855948
$GPRP,74915D4253F8,C2E3301C731B,-73,02011A020A0C0AFF4C0010055E1C1BD2B5,1571855948
$GPRP,769A668E87A7,C2E3301C731B,-92,02011A020A0C0AFF4C00100503183F07D2,1571855948
$GPRP,30577CFEB6F3,C2E3301C731B,-65,1EFF0600010920023C43EA1413D40836D664A542F62640EB2277A043E7D913,1571855948
$GPRP,01F9BF4918AA,C2E3301C731B,-98,1EFF060001092002D0CE87C2A286D03038FE638259D0382691F9E46E0C76BB,1571855948
$GPRP,74802DB4E25D,C2E3301C731B,-51,02011A020A0C0AFF4C001005031C035C01,1571855948
$GPRP,AC233FA054B7,C2E3301C731B,-61,0201060303E1FF0E16E1FFA10864B754A03F23AC5331,1571855948
$GPRP,74915D4253F8,C2E3301C731B,-73,02011A020A0C0AFF4C0010055E1C1BD2B5,1571855948
$GPRP,5AF1927F967F,C2E3301C731B,-82,02011A0AFF4C001005071C101707,1571855948
$GPRP,3468958805F0,C2E3301C731B,-60,02011A1107FC9DD0B3CB84E0840642F3F7E1E0BFCB,1571855948
$GPRP,5413792CD278,C2E3301C731B,-88,02011A1107FC9DD0B3CB84E0840642F3F7E1E0BFCB,1571855948
$GPRP,3468958805F0,C2E3301C731B,-59,1DFF2D010200011076DA132B92034D34962819DAFB7329457181589D10EE,1571855948

The basic format of each message is the same.

$report type,tag id,gateway id,rssi,raw packet content,*unix epoch timestamp

Where the message parts are defined below.

report type GPRP: general purpose report . SRRP: active scan response report
tag id MAC address or ID of tag/beacon
gateway id MAC address of gatewayโ€™s BLE
rssi RSSI of tag/beacon
raw packet content Raw packet received by the gateway
unix epoch timestamp Optional timestamp when NTP is enabled

Filtering the Data

To filter the data so we only see the messages sent from our sensors is made simple by the fact that the message contains the MAC address of the originating message.

Therefore we can add a switch node to only allow process our MAC addresses. In this case MAC address AC233FA054C6 will go to output 1, AC233FA054C7 to output 2 and everything else to output 3.

If we don’t connect any downstream nodes to output 3 they will be effectively discarded. By splitting our sensors by output we are also able to label them so in the following nodes I use a function to identify which device is inside and which is outside.

Flow split by sensor MAC address/location

Here the sensor being sent to output 1 is the one inside so the function creates a flow variable called ‘location‘ I’ll use later in the flow.

Output 1 function

Message Slots

Now we’ve removed all the data not related to our sensors you notice that we still get two different messages from each sensor.

If you remember when we set up the S1 sensor beacon we only activated two slots. This means that the sensor will actually send two messages, one with some general info and another with our temperature and humidity data. If we had left all six slots activated we would receive six different messages.

The actual messages look like these.

$GPRP,AC233FA054C6,C2E3301C731B,-61,0201060303E1FF0E16E1FFA10864C654A03F23AC5331,1571855948
$GPRP,AC233FA054C6,C2E3301C731B,-52,0201060303E1FF1016E1FFA1016417633C70C654A03F23AC,1571855949

If we take the first message payload only (0201060303E1FF0E16E1FFA10864C654A03F23AC5331) we can see that it’s split into header and data sections as shown below.

Info Slot data

This turns out to be the info slot. Note that the message is in hex format so battery level 64 actually equals 100 in decimal and 5331 equals S1, or the name of the sensor.

The next slot we assume must be our temperature and humidity data.

Sensor Slot Data

Since the headers for the temperature/humidity data are slightly different (they end in 01 instead of 08) from the info data we can now modify our switch node so we only get our sensors and we only see the temperature/humidity slot.

Converting Temperature and Humidity

The next challenge is actually getting the temperature and humidity from the data. You might think this is also hex encoded but you’ll see that hex 1763 is 5987 in decimal and 3C70 is 15472 so it seems we have some conversion to do.

Actually this data is encoded in signed 8.8 fixed point notation! Fortunately I’m not the first person to ask the question regarding decoding sensor data so the answer is conveniently on Stack Overflow, as always ๐ŸคŸ

If we use the function shown below with our values for temp and humidity we get the correct data out.

function FixedPoint(fraction){
  this.fraction = fraction;
}

FixedPoint.prototype.calculate = function(value){
  let intValue = parseInt(value, 16);
  let signed = (intValue & 0x8000) > 0 ? -1 : 1;
  return signed * intValue / Math.pow(2, this.fraction);
}

let decodData= new FixedPoint(8);
decodData.calculate('1763');

Our data point of 1763 converts to 23.3203125 which looks like a reasonable temperature and the humidity of 3C70 converts to 60.4375.

To be sure the data agrees you can open the BeaconSET+ app and check the readings there.

Check temp and humidity from the BeaconSET+ app

Final Function

Putting these steps together I have a single function to process the data, it

  • Get the sensor locations from the saved variables (switch node)
  • Uses split() to get the timestamp from the message
  • Converts UNIX timestamp to JavaScript Date object
  • Use split() to get the advertising payload from the message
  • Extract tempo and humidity strings
  • Convert to hex and decode from fixed point to decimal
  • Create a msg.payload for writing to the debug window.
// Convert IUnix time to Date
function UnixToDate(unix_timestamp){
    return new Date(unix_timestamp*1000);
}

// signed 8.8 fixed point functions
function FixedPoint(fraction){
  this.fraction = fraction;
}
FixedPoint.prototype.calculate = function(value){
  let intValue = parseInt(value, 16);
  let signed = (intValue & 0x8000) > 0 ? -1 : 1;
  return signed * intValue / Math.pow(2, this.fraction);
}

//get location from variable
var location = flow.get('location') || '';

let decoder= new FixedPoint(8);

//get timestamp from message
unixtime = parseInt(msg.payload.split(",")[5])

//get advertising message
data = msg.payload.split(",")[4]

// get temperature
hextmp = "0x" + data.substr(28,4)
dectmp = decoder.calculate(hextmp);

//get humidity
hexhum = "0x" + data.substr(32,4)
dechum = decoder.calculate(hexhum);

// create msg.payload
msg.payload = "Location:" + location + "\n" +
                "Temp: " + dectmp + "c" + "\n" +
                "Humidity: " + dechum +"%" + "\n" +
                "Time: " + UnixToDate(unixtime)
return msg;

When deployed we see the following data in the debug window. Success!

Collected sensor data output in Node-RED

Our full flow in Node-RED is shown below, very small for what we have achieved.

Full flow in Node-RED

How to use Amazon S3 from KNIME

This post follows on from my S3 post usng Node-RED so you can read that for a brief into to S3. Using S3 with KNIME is extremely easy as there is already an S3 node available to install.

Amazon S3 Connection

The only node that needs installing is the Amazon S3 Connection.

KNIME Amazon Cloud Connections

All the other nodes required to upload, download or list remote files are already installed in the IO section of the Node Repository in KNIME as shown here.

Amazon S3 connection in the IO section

A simple workflow to upload a file and list remote files in the S3 bucket looks like this.

S3 Credentials

The S3 connection node is easy to set up and I recommend using the standard AWS credentials file so your do not save your id and key in the KNIME workflow. It’s clearly documented on the AWS site.

The only trick is to create folder starting with a dot (.) is not possible on Windows using Windows Explorer. To create the folder you must open a command line and use the mkdir command.

C:\Users\username>mkdir .aws

S3 Connection Node

Configure the node to use your credentials file and select your AWS region. Test the connection before continuing to make sure everything works as expected.

Upload to S3

Simply choose the target directory on S3 you wish to upload your files to, in this case I’m uploading to a sub directory called nodered. As well as the S3 connection this node expects a list of URIs as shown in the initial flow overview. This is standard KNIME and uses a List Files node followed by a String to URI node.

List S3 Files

As with uploading this node asks for the S3 directory to list and by default will list all the files in you bucket.

Here the remote files are displayed.

Format and Mount External Hard Drives in Linux

Assuming you’ve just bought a new external hard drive or you have one that’s already in use these are the steps you need to take to make it usable with Linux.

โš ๏ธ Be aware that following these steps will reformat the drive causing all data to be permanently erased. You’ve been warned.

First connect the USB drive to the Linux computer and open a terminal session. Run the following command.

$ lsblk -o UUID,NAME,FSTYPE,SIZE,LABEL,MODEL

This will out put something like this.

UUID                                 NAME        FSTYPE   SIZE LABEL  MODEL
                                     sda                931,5G        External_USB_3.0
19b2561e-cd18-46dd-bf87-b176c7cdd7a0 โ””โ”€sda1      ext4   931,5G        
                                     mmcblk0              7,4G        
5203-DB74                            โ”œโ”€mmcblk0p1 vfat     256M boot   
2ab3f8e1-7dc6-43f5-b0db-dd5759d51d4e โ””โ”€mmcblk0p2 ext4     7,2G rootfs 

Note the name of the attached drive, in my case sda1 and run the command below using the name of your drive. This command will format the drive as ext4.

$ sudo mkfs.ext4 /dev/sda1

The output of this command will include a UUID, copy this string for the next step. Open the /etc/fstab file using a text editor and (nano in my example) add this line using the UUID you copied from the previous command.

$ sudo nano /etc/fstab

# add this line
 UUID=this_is_your_uuid /mnt/hdd ext4 rw,nosuid,dev,noexec,noatime,nodiratime,auto,nouser,async,nofail 0 2

Make a directory to mount the drive to, /mnt/hdd in this example, and mount the drive. The mount point should match the fstab file you just created.

$ sudo mkdir /mnt/hdd
$ sudo mount -a

Check the file is mounted by running df (disk free).

$ df /mnt/hdd/
Filesystem     1K-blocks  Used Available Use% Mounted on
/dev/sda1      960379496 78000 911447092   1% /mnt/hdd

Finally change the owner of the mounted drive to your normal user, in my case pi (it’s currently owned by root).

$ sudo chown -R pi:pi /mnt/hdd/

IoT Sensors – Getting Started

IoT sensors and Bluetooth gateway
IoT starter pack

Introduction

I’ve been interested in setting up some home monitoring/automation since getting my first Raspberry Pi a couple of years ago. After using the device for various development projects I finally decided on my first project, try to make a basic home temperature/humidity monitor that cold measure both indoor and outdoors.

The idea is to end with a simple dashboard that can be accessed from a mobile device with the current temperature and maybe a chart with some history. This will require me to both access the live data and to store it for later analysis.

Apart from being a leaning experience and ending with a useful product I also had a few basic requirements for the project.

I didn’t want to run wires around my flat and I wanted an open, non-propitiatory platform that could be extended with other sensors at a later date. I also wanted access to the ‘raw’ data coming from the sensors so I could process and store as I desire.

This means no Apple HomeKit, Samsung Smartthings or Google Home based system, which although probably easy to set up is inherently ‘closed’.

With this goal in mind I selected a Bluetooth Low Energy (BLE) system using beacons and a gateway to collect and forward the data (or advertising data in beacon speak).

The Hardware

Sensors

Minew S1
Minew S1

For the sensors I bought two Minew S1 Temperature/Humidity sensors that can be used both indoors and outdoors. These gather data and send the data via Bluetooth at regular intervals that can be determined by you. In my case I collect the data using a Bluetooth Gateway described next but the data could be collected by an app or other device.

The sensor can be configured easily via an app on both Android and iOS.

Bluetooth Gateway

The gateway is an Ingics IGS01S and collects data from Bluetooth devices and forward the payloads (data) via your WiFi. It’s basically a bridge between Bluetooth and WiFi. It can be configured to send the data via multiple methods such as MQTT or HTTP POST (think api).

The device is very small (54mm X 41mm x 18mm) and runs off micro usb using very little power.

Ingics IGS01S Gateway

Configuration of Hardware

Configuring the S1 Sensor

This is well described many places so I’ll be brief. I should mention that to turn the sensor on is a 3 second press on the button on the base, the same will turn the beacon off. To set the beacon up:

  1. Install the BeaconSET+ app from the App Store or Google Play
  2. Follow this guide to disable unused slots (saves power and makes later steps easier)

I set my beacon to send data every 3 seconds as this is adequate for my needs.

Configuring the Gateway

This is also well documented as INGICS have an iGS01S User Guide in pdf format. All configuration is done via the built in web configuration tool and can be done from any device.

To summarize:

  1. Add antenna and power on (plug in)
  2. Gateway starts in AP mode allowing WiFi connections
  3. Connect to AP via WiFi from a device with web browser
  4. Access the web configuration portal at 192.168.10.1
  5. Configure with you own WiFi settings
  6. Configure the gateway application setting (MQTT or HTTP POST)
  7. Optionally add BLE filters to limit which beacons are forwarded

After configuring and rebooting you can then access the web portal from your own WiFi as it will join your local network and get an IP address from your router. I recommend giving the gateway a fixed IP address by logging into your router and reserving the IP as this will make it easier to locate in future (although it has no effect on functionality).

Applications Settings (MQTT or HTTP)

My settings for the Application tab are shown below. I’m using an MQTT client (Node-RED) running on my Raspberry Pi at 192.168.1.118. Port 1883 is the standard MQTT port and I’ve chosen a topic called sensor that I’ll be using later when we set up Nod-RED.

Gateway Application Configuration for MQTT

BLE Filters

By default the gateway will collect and forward all Bluetooth data it detects so if you wish to only see your sensors you’ll have to filter out the ‘noise’ in your processing application. Another alternative is to set BLE filters in the gateway, this is documented here, an extract is shown below.

Payload filter is used as filter to keep specified beacons by using payload matching.
Assume your beacon has below report:
$GPRP,0007802DDB1E,C946A6500A33,-43,0201061AFF660200215BC6010015000000F00000000
If your beacons has a fixed field "6602" in above report, you can set
Payload Pattern: 0201061AFF6602
Payload Mask: 0000000000FFFF
Then the gateway will only forward the report when "pattern & mask" matches 6602.
Ex. To match iBeacon:
Payload Pattern: 0201061AFF4C00
Payload Mask: FFFFFFFFFFFFFF

Where you decide to filter doesn’t make that much difference but of course if you filter in your downstream application you’ll be sending a greater volume of data from the gateway. If this isn’t an issue it’s probably easier just to send everything from the gateway.

Another filtering option is to use the RSSI (received signal strength indicator) slider. Moving it further to the right will filter out weaker signals so signals from distant sources will be removed.

The BLE filters are configured in the Advanced tab in the gateway.

Advanced configuration tab

Time Stamping

To enable the gateway to add the timestamp to each message you must enable the NTP server in the System tab. This enables the gateway to look up the current time from an online NTP server at regular intervals.

Enable ntp server
System tab with NTP settings

Once configured the gateway will begin collecting beacon data and forwarding to the MQTT server. We haven’t set up the server yet so the messages will not be received but you won’t see any errors in the gateway.

Next Steps

Now we have the sensor and gateway working in the next part I’ll move to reading the sensor data from the gateway using Node-RED.

Recovering Node-RED Flows After Changing Hostname

I recently changed the hostname on my Raspberry Pi and was rather surprised (and initially worried) when the next time I started Node-RED all my flows has disappeared ๐Ÿ˜ฑ

It turns out that the flows are connected to the computer hostname by their naming convention. Someone even filed a bug regarding this unexpected behavior.

The reason lies in the naming of the configuration files. If you take a look in the .node-red directory you’ll see something like this.

pi@thor:~ $ cd .node-red/
pi@thor:~/.node-red $ ls
flows_raspberrypi_cred.json  lib           package.json       settings.js
flows_raspberrypi.json       node_modules  package-lock.json

Here’s you see two files that both contain the hostname (raspberrypi).

The fix is simple, just rename the files replacing the old hostname with the new hostname.

pi@thor:~ $ mv flows_raspberrypi_cred.json flows_thor_cred.json
pi@thor:~ $ mv flows_raspberrypi.json flows_thor.json

Node-RED will need to be restarted to pick up the new configuration.

pi@thor:~ $ sudo systemctl restart nodered

Piping Bitcoin RPC Commands

If you want to get the block header of the latest block generated on the bitcoin blockchain using bitcoin-cli it’s a little tricky (and hard to say!). You need to first find the latest block number (height), then find the hash of that block and then get the header using the hash.

Since the getblockheader command expects a blockhash as a parameter I use pipes to feed the result of one command into the next.

The pipe runs the following commands in this order.

  • First get the chain height using getblockcount
  • Feed this result to getblockhash to get the hash
  • Feed this result to getblockheader
  • Result is the header of the latest block

The result is a one line command to get the latest block header!

$ bitcoin-cli getblockcount | xargs bitcoin-cli getblockhash | xargs bitcoin-cli getblockheader
{
  "hash": "00000000000000000001e372ae2d2bc91903bd065d79e126461cd2bf0bbe6b3d",
  "confirmations": 1,
  "height": 600417,
  "version": 545259520,
  "versionHex": "20800000",
  "merkleroot": "e58f963d486c0a626938851ba9bfb6e4886cabcf2302573f827ca86040f997a3",
  "time": 1571688192,
  "mediantime": 1571685251,
  "nonce": 1693673536,
  "bits": "1715a35c",
  "difficulty": 13008091666971.9,
  "chainwork": "000000000000000000000000000000000000000009756da038619f842bfff6b6",
  "nTx": 2577,
  "previousblockhash": "0000000000000000000dbd8aada824ee952e87ef763a862a8baaba844dba8af9"
}

IoT with Node-RED and Python

Raspberry Pi + Node-RED + Python + MQTT

Now I have two Raspberry Pis running, one as a Bitcoin full node and the other mostly used as a dev/experimentation machine I decided it’s time to put the dev machine to some use.

I’d also like to learn more about IoT (Internet of Things) and how they are wired together and communicate so this is a great opportunity to ‘Learn by Doing’.

To this end I’ve started to experiment with the MQTT messaging protocol that is commonly used for IoT devices.

To start, what is MQTT?

MQTT (Message Queuing Telemetry Transport) is an ISO standard, lightweight, publish-subscribe network protocol that transports messages between devices.

MQTT on Wikipedia

This allows us to very easily send sensor data between devices without having to invent the communication medium ourselves. Most IoT gateways support MQTT out of the box and it’s widely supported across many programming languages (list here).

As a test I’ll create a Node-RED flow on my Raspberry Pi that will publish (send) messages to a local MQTT server, these messages will then be ‘read’ by a python script running on my Windows laptop. I’ll also add a flow where the python script on Windows publishes messages that are then read by the Node-RED flow.

Node-RED Flow

MQTT Node-RED flow
MQTT Node-RED flow

MQTT in and out nodes are included as part of the standard installation on Node-RED so creating a flow is trivially easy. All the MQTT part is contained in a single node while the rest of the flow is just creating the message to send.

Publish Flow

MQTT Publish flow
Publish flow

The inject nodes are just to manually trigger the flow. The true trigger causes the exec node to execute a command on the Raspberry Pi, in this case it gets the system temperature. This is then published to the MQTT server in the ‘iot‘ topic.
The command to get the system temperature on a Raspberry Pi is shown here.

$ /opt/vc/bin/vcgencmd measure_temp

Topics in MQTT are just ways to keep different messages together, if you publish to a specific topic then other clients subscribed to the topic will receive the messages.

Subscribe Flow

MQTT Subscribe flow
Subscribe flow

The lower two nodes are used to subscribe to a topic I’ve called ‘python‘. This is triggered when the python script publishes to the topic and the message will be outputted to the debug console in Node-RED.

Configuring the MQTT Nodes

By default the MQTT nodes use a local server on port 1883 that is already set up for you. Unless you want to use your own server or a remote server just leave these as-is. The topic is entirely up to you, just make sure you use the same topic in the client used to read the messages.

MQTT server configuration

MQTT Python Script

For the python client running on my laptop I’ll use the Eclipse Paho library. To install use:

pip install paho-mqtt

The full script looks like this.

import paho.mqtt.client as mqtt
import os

# The callback for when the client receives a CONNACK response from the server.
def on_connect(client, userdata, flags, rc):
    print("Connected with result code "+str(rc))

    # Subscribing in on_connect() means that if we lose the connection and
    # reconnect then subscriptions will be renewed.
    client.subscribe("iot")

# The callback for when a PUBLISH message is received from the server.
def on_message(client, userdata, msg):
    print("Topic: {} / Message: {}".format(msg.topic,str(msg.payload.decode("UTF-8"))))
    if(msg.payload.decode("UTF-8") == "Reply"):
        client.publish("python", os.environ.get('OS',''))

client = mqtt.Client()
client.on_connect = on_connect
client.on_message = on_message

# Use the IP address of your MQTT server here
SERVER_IP_ADDRESS = "0.0.0.0"
client.connect(SERVER_IP_ADDRESS, 1883, 60)

# Blocking call that processes network traffic, dispatches callbacks and
# handles reconnecting.
# Other loop*() functions are available that give a threaded interface and a
# manual interface.
client.loop_forever()

The code is well commented but essentially it creates a connection to the MQTT server (created by the Node-RED flow on my Pi). Replace the IP address with your local server or use 127.0.0.1 if the script runs on the same computer as the server.

The script then waits for messages in the ‘iot‘ topic and when received it prints the message to the console. If the message is ‘Reply’ then the script also publishes a message (the Windows OS version) to the ‘python‘ topic which will be picked up by the Node-RED flow and displayed there.

Putting it Together

To start sending and receiving messages first deploy the Node-RED flow and then start the python script. Running the python script returns this showing the script is now waiting for messages.

>python mqtt.py
Connected with result code 0

Injecting the ‘true‘ node will query the Pi for the system temp and send this to the ‘iot‘ topic on the MQTT server which the python script will pick up and display as shown below. Here I ran the flow four times so we get four messages with temperatures displayed in python on my laptop.

Topic: iot / Message: temp=48.3'C
Topic: iot / Message: temp=48.9'C
Topic: iot / Message: temp=48.3'C

If I now send the ‘Reply‘ message from Node-RED we see this in python.

Topic: iot / Message: Reply

In Node-RED we see a debug message with the message sent from python to the ‘python‘ topic we subscribed to in Node-RED (โ€œWindows_NTโ€).

Node-RED debug output

Testing from iOS

In the app store there are quite a few MQTT clients available. I tried a few but MQTTool was the most reliable for me. It allows you to connect to a server and both publish and subscribe to topics. Just connect to your MQTT server and test!

Next Steps

This was a trivial example of using MQTT to send and receive messages but the next plan is to extend this with sensor data that can be send to Node-RED running on a virtual server.

This way I can securely make sensor data available form the internet as well as choosing to store the data in a database or cloud storage service.

Introduction to Image Classification using UiPath and Python

Image classification
A python!

After my previous post showing image classification using UiPath and Python generated many questions about how to implement the same I decided to expand upon the theme and give a more detailed description about how to achieve this.

My starting point was thinking how I might integrate UiPath with python now that it’s integrated within the platform.

I find thinking of potential solutions and use cases just as much fun as actually making the automations and it feeds the creative mind as well as the logical.

Python is also growing explosively right now and this leads to a vast array of possibilities.

To see just how python is growing see this article from Stock Overflow.

Programming language popularity
Python Growth!

The first thing to point out is that although I used UiPath as my RPA platform this could in theory be any platform that supports python. I also use Alteryx and this could easily be integrated into an Alteryx workflow to programatically return the classifications and confidence levels.

Note that these instructions cover installation on Windows but the python and Tensorflow parts could easily be done on Mac or Linux, just follow the instructions.

Basic Requirements

Python

Obviously this won’t work without Python being installed ๐Ÿ™„ I used Python 3.5 but any Python 2 or 3 version should work. Download Python for free and follow the installation instructions. There’s a useful guide to the installation process at realpython.com. This is easy and will take 10 minutes to get going.

Tensorflow

This is the python library that does the heavy lifting of the image classification. Or in the words of Wikipedia:

TensorFlow is an open-source software library for dataflow programming across a range of tasks. It is a symbolic math library, and is also used for machine learning applications such as neural networks.

Wikipedia

It’s completely free to use and released by Google. I won’t go into the installation in detail since it’s well documented on the Tensorflow site, but the whole process took me another 10 minutes. Easy as ๐Ÿฅง

Python 3.X installs the pip package manager by default so in my case installing Tensorflow was as simple as typing the following command into the command line.

pip install --upgrade tensorflow

UiPath

RPA (Robotic Process Automation) is also growing exponentially right now so it’s a great time to learn how it works and what benefits it can bring.

The RPA software market overall witnessed a growth of 92 to 97 percent in 2017 to reach US$480 million to $510 million. The market is expected to grow between 75 and 90 percent annually up to 2019.

If you don’t already have RPA software and want to integrate into an automated solution you can download and use the community version of UiPath for free (Windows only).

UiPath is very powerful and yet easy to use, but apart from the technology a major advantage they have is the large and growing community so solutions are often posted to their forums. On top of that they have free training available online. What’s not to like?

Download the Tensorflow Models

Let’s get into the details now starting with downloading the models we will use.

If you use git you can clone the Tensorflow models repository using this link; https://github.com/tensorflow/models

Otherwise you can use a browser and navigate to the above page and then download the models as a zip file using the link in the top right corner.

Clone from Github

Save the zip file to your computer and unzip somewhere on your C: drive. The location isn’t important as long a you know where it is.

Download the Pre-trained Model

This can be done in one of two ways, either:

Method 1

Find the location of the unzipped models file from the previous step and go into the following directory (in my case the root directory is called models-master), models-master > tutorials > image > imagenet

Once there open a command prompt and run the python file called classify_image.py

imagenet output
Your first classified image

If all goes to plan this downloads the pre-trained model to your C drive and saves it to C:\tmp\imagenet, it also runs the classifier on a default image in the downloaded folder. As you can probably work out the image is of a panda ๐Ÿ™‚

giant panda, panda, panda bear, coon bear, Ailuropoda melanoleuca (score = 0.89632)
indri, indris, Indri indri, Indri brevicaudatus (score = 0.00766)
lesser panda, red panda, panda, bear cat, cat bear, Ailurus fulgens (score = 0.00266)
custard apple (score = 0.00138)
earthstar (score = 0.00104) 
panda

If you got this far, well done, you’ve already done image classification using python and Tensorflow!

If you get warning in the output, as I did, you can safely ignore these assuming the classifier still produces the output. These are purely because we are using the default Tensorflow library that is designed to work across as many CPUs as possible so does not optimise for any CPU extensions.

To fix these you would need to compile Tensorflow from source which is out of scope for this tutorial (see here for more info, https://stackoverflow.com/questions/47068709/your-cpu-supports-instructions-that-this-tensorflow-binary-was-not-compiled-to-u)

Method 2

Alternatively you can take a shortcut and download the pre-trained model directly from here, http://download.tensorflow.org/models/image/imagenet/inception-2015-12-05.tgz

Extract the files (you’ll need something like 7-zip for that) and save them to C:\tmp\imagenet so it looks like this:

Modify the Image Classifier for Automation

The classify_image.py python script could easily be used directly with python but as it stands the script only prints the data to the command line and does not return any data from the function.

We could just change the script to write the output to a text file which UiPath could read, but it’s much cleaner and more efficient if we alter the code to return a list from the classifier function which can be converted into a .NET object in UiPath.

This also gives us the advantage that we can load the script just once into UiPath and then call the classifier function each time we need to classify an image saving considerable time and resources.

The modified python file (‘robot_classify_image.py‘) can be downloaded from my github repository, https://github.com/bobpeers/uipath, and placed somewhere where it can be called from your automation workflow.

To test the file works you can call it from a command line as follows.

C:\>robot_classify_image.py <full_path_to_image> <number_of_predictions>

For example this will return three predictions on the bike image.

C:\>robot_classify_image.py "C:\work\UiPath\Images\images\bike.jpg" 3

By default the script will not print the results to the console but if you wish to see them simply uncomment the print() line in the script:

for node_id in top_k:  
    human_string = node_lookup.id_to_string(node_id)
    score = predictions[node_id]
    #enable print for testing from command line
    #print('%s (score = %.5f)' % (human_string, score)) 
    returnValue.append("{0:.2%};{1}\n".format(score,human_string))

Note that if you saved the pre-trained model somewhere other than C:\tmp\imagenet you can edit the python to point to the saved location by replacing all the instances of ‘/tmp/imagenet/‘ with your path (be sure to keep the forward slashes).

UiPath Workflow

Most of the hard work is now done. It’s only left for us to integrate this into a UiPath workflow which is simple ๐Ÿ˜Š

Use a Python Scope

All the python activities must be contained inside a Python Scope container.

Set the path to your installation path and target to x64 for 64 bit systems or x86 for 32 bit. Leaving the version as auto will auto-detect your version.

Load the python script

First we load the python script into UiPath using a Load Python Script activity.

Setting the result of this activity to a variable, in my case called pyScript.

Invoke the Python Method

Next we use the Invoke Python Method activity that will actually run the classification method.

In the Invoke Python Method activity enter the name of the function to call (‘main‘) along with the script object from above as ‘Instance’.

The function ‘main’ expects two arguments (‘Input Parameters’), the full path to the image file and the number of predictions required, sent as an array using variables in my case.

The function returns a Python Object called pyOut in my case.

Get Return Values

The Get Python Object takes the returned value (pyOut) from the previous activity and converts it into an array of strings (which is the return value from python)

We can then loop through the array and extract each line from the prediction and use for further processing or display on a callout as I did in the video.

All finished, take a coffee on me ๐Ÿ˜…

Summary

Once the basics are set up, using the classifier is extremely easy and returns values very quickly. As you look at more images you’ll also realise that sometimes the model is not certain on the results so make sure you check the confidence level before continuing processing.

My suggestion would be to automate anything over 80-90%, depending on the use case of course, and putting everything else aside for manual handling.

The classifier uses about 1000 classes to identify objects but you could always retrain the classifier on your own images. The Tensorflow documents are here, https://www.tensorflow.org/hub/tutorials/image_retraining if you want a challenge.

Have fun ๐Ÿค–๐Ÿ’ช